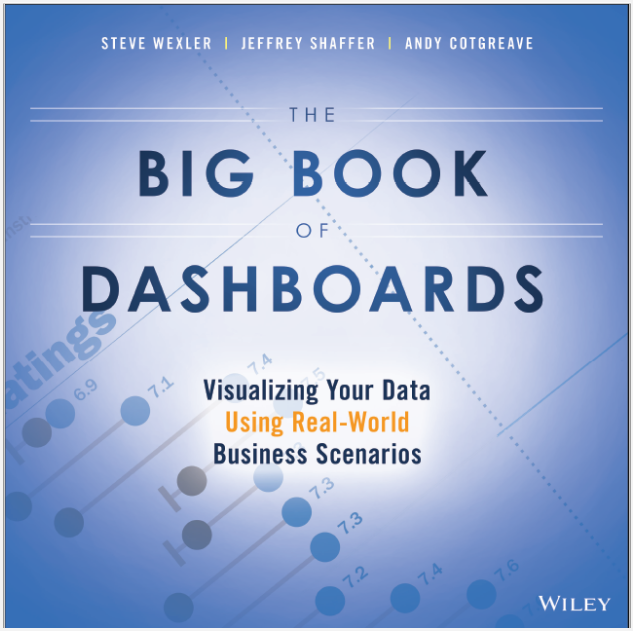
Starting with good data visualisation design practices, The Big Book of Dashboards then goes into 28 case studies of business dashboard designs of real world examples. The case studies themselves are software agnostic, but you can obtain Tableau versions of a number of them for free. This book aims to inspire and provide re-usable design approaches that analysts and reporters can take away and deploy on their own data.
Written by Steve Wexler (of Data Revelations), Jeffrey Shaffer (of Unifund) and Andy Cotgreave (of Tableau) The Big Book of Dashboards has quickly become the go-to book for practical design concepts that can be implemented immediately across all sectors.
Need some help being able to produce these insights? Our Tableau Training courses can help.
You can purchase a copy from here.
Here’s what Alberto Cairo (Author of The Truthful Art: Data, Charts and Maps for Communication) has to say:
“Some books about visualization focus on principles and guidelines, but they don′t devote enough pages to explain how to apply them to the design of complex, multi–section displays, like business dashboards. This book is the opposite of that. While the book contains an introduction to data visualization fundamentals, it is the numerous examples of real dashboards that sets it apart. If you′ve ever found yourself stuck when creating a dashboard, you will likely find a solution here. “
This book has clearly benefitted from having multiple authors and reviewers. Designing dashboards that work well requires a collaborative and iterative approach. Putting your hand up and saying “That works, lets go with it” is also an important factor and the authors make comments and suggestions on the dashboards as to how they could be changed for different audiences or different types of data sets.
Chapter 2 – Course Metrics Dashboard
By the chapter number, you already know that this book gets straight to the point. This chapter looks at the common requirement of comparing an individuals results to both peer group and “total” benchmarks. I like the way they deal with visualising data sets with different submission timelines. In this case, they are comparing course feedback information with the latest attendance numbers. The feedback comes from a course attendee feedback survey and therefore is received with a time delay compared to the course attendance data – and the approach visualises well.
As is common, there is also the need to provide both summary and granular level detail and they talk through the use of a dot plot approach which works for comparing aggregated results from multiple sources.
A common thread throughout is their approach to using colour in visualisations. In my humble opinion, just because you can, doesn’t mean you should, and this dashboard is a great example of a minimalist approach by making sure that when colour is used, it has meaning and adds value to the consumer of a report.
I will continue to add Chapter reviews to this post.
